|
What is it?
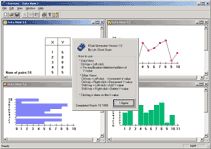
It's what it says it is, a chart generator. Different views to represent numeric data
are provided, like lines, bars and columns. You can add, modify, and delete values too. I suppose you could say it's a very very
stripped down version of a representation of spreadsheet data. I wrote this for the subject "MFC Programming", and finished it within
one week when we were given 3 months to finish it. The lecturer presented it front of the entire course, cool huh, it was suppose to
inspire them. :-) I scored almost a perfect score for this assignment. Anyway...

|
| Screenshot |
How it works
Wow, what a can of worms. This program is written in MFC, the Microsoft Foundation Classes, in Visual C++. This program just demonstrates uses of the MFC architecture,
namely the Document/View architecture. What is it? Basically the document is data, while the view shows the graphical representation of that data. The key concept was
using that architecture to write the program, so everything stays synchronized. How is that done, too complicated, actually, function calls.
MFC is an hierachy of classes, a wrapper class over the Windows API, it is pretty confusing at first but once you get the hang of it it's alright. I further added to the program by providing real-time updating of values to reflect view
changes. If you update a view, say a bars view, and you open up a lines view, the lines view is updated as well.
If your head isn't spinning yet, check out my
wave editor
and
other cool projects.
How it was implemented
Software used:
- Visual C++ using MFC
- Windows 9X/NT
Coding was done in Visual C++ and software testing on the Win 9X/NT platform.
|